
US Portfolio OverviewDashboard- III
Using Plotly, Dash and bootstrap
With the help of below dashboard, one can keep track of the stocks portfolio. The best thing about it is that one can do the changes as per his/her requirement.
Here is the link to the
Google drive folder which includes the code in python notebook(.ipynb) file and the necessary explanations of all visual charts and plots in this project.
This dashboard is made in pure Python language. It mainly uses Plotly and Dash packages for practical visualization of a US stock market's Portfolio and some Bootstrap is also used to give it some style.
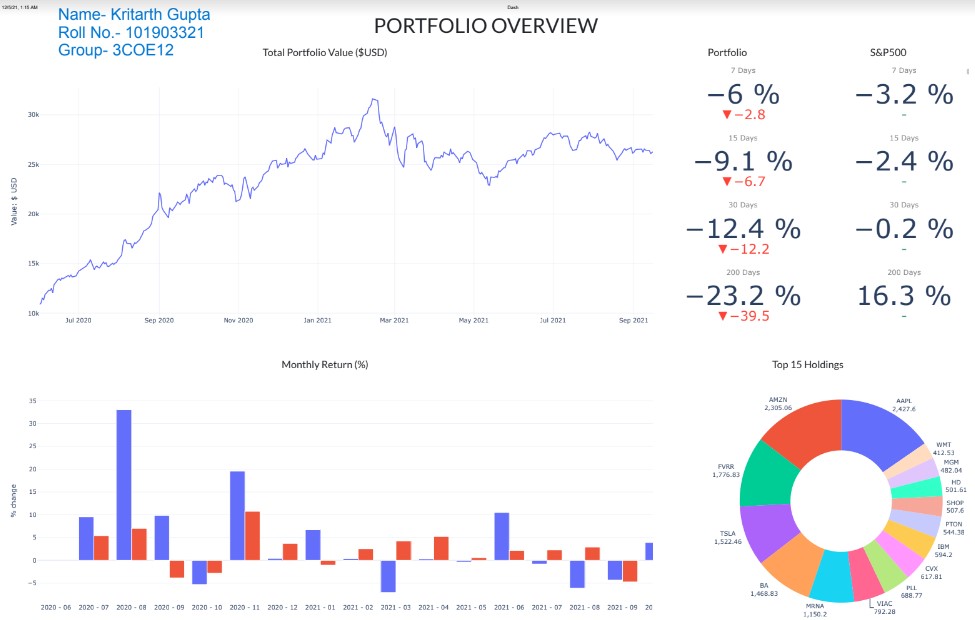
It gives an overview of necessary insights like total portfolio value($USD), Monthly Returns(%), Portfolio and US market's comparison and Top holdings.
On the left hand side we see 2 graphs. The first one tells us about the trends in total Portfolio value till date and the Second graph tells us the %age change in the returns on monthly basis.
On the right hand side, firstly we have Key performance indicators (KPIs) for our portfolio and S&P500 index that help us monitor and make decisions about our stock. Below that we have information regarding our Top 15 Holdings that are giving us maximum monthly returns.