
Company's Sale Report Dashboard- II
Using Google Data Studio

This dashboard is made using Google Data Studio and is a practical visualization of a Company's Sales Report.
It gives an overview of total sales, orders and customers. Also it gives a detailed report of sales and orders by time period, customer location and sales person.
Here is the link to the
project and
dataset used.
The following is what has been done :-
- Connecting financial data through Google Sheets.
- User friendly buttons to move around the report.
- Date range selection button on the top of the report header.
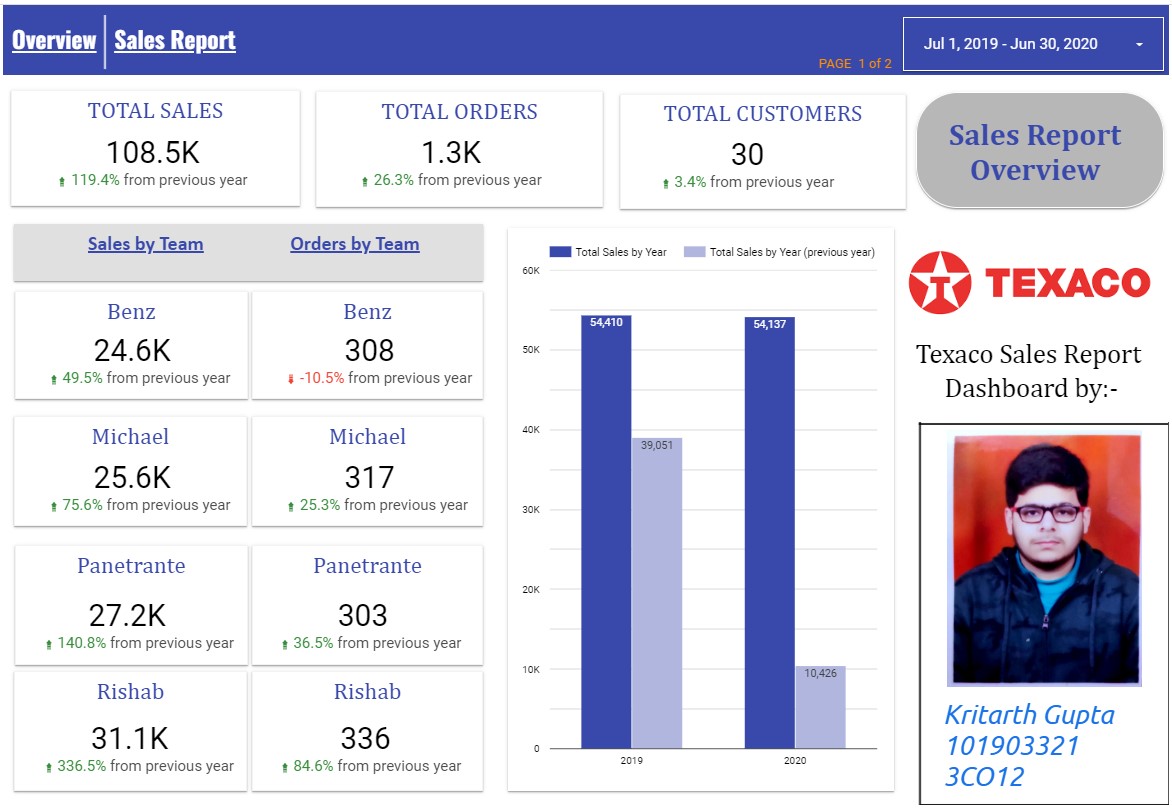
- Creating an overview of the Sales report.
- Creating Time Series charts of Sales orders and customers.
-There is also a separate page of an overview of the following:
-
Total Sales
Total Customers
Total orders
Sales value according to each sales individual
Orders count of each sales Individual
Time Series Chart to show the data of Yearly sales
-
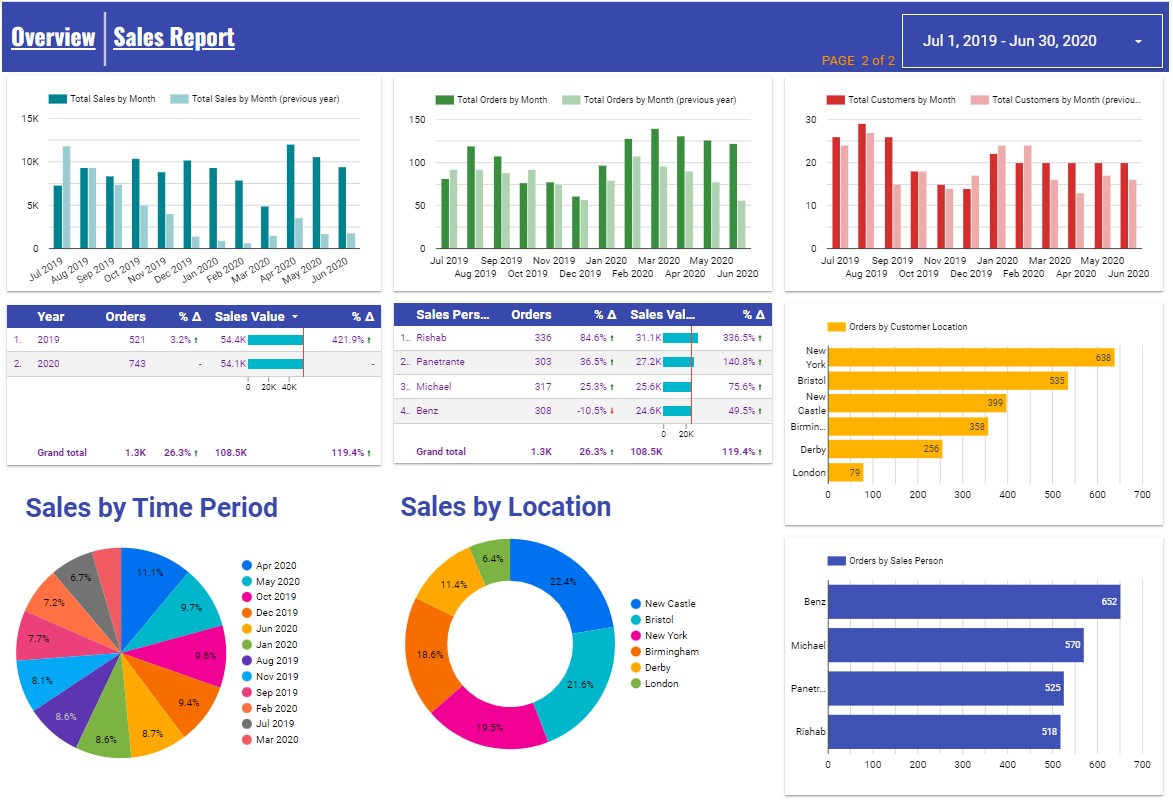
Time series charts of Monthly Sales value in comparison of previous year data
Time series charts of Monthly Orders value in comparison of previous year data
Time series charts of Monthly Customers engaged in comparison of previous year data
Tables of yearly Sales and orders with the help of Target achievements
Table of Sales executive orders & Sales with the help of their Target achievements
Pie charts in terms of Period and Location vise sales
Bar Charts to see the Total sales by each Sales Person and orders