
Profit and Loss Report Dashboard- I
Using Google Data Studio

This dashboard is made using Google Data Studio and is a practical visualization of a financial dashboard.
It shows weekly, monthly and annual web responsive financial reports that are dynamical and meaningful.
Here is the link to the
project and
dataset used.
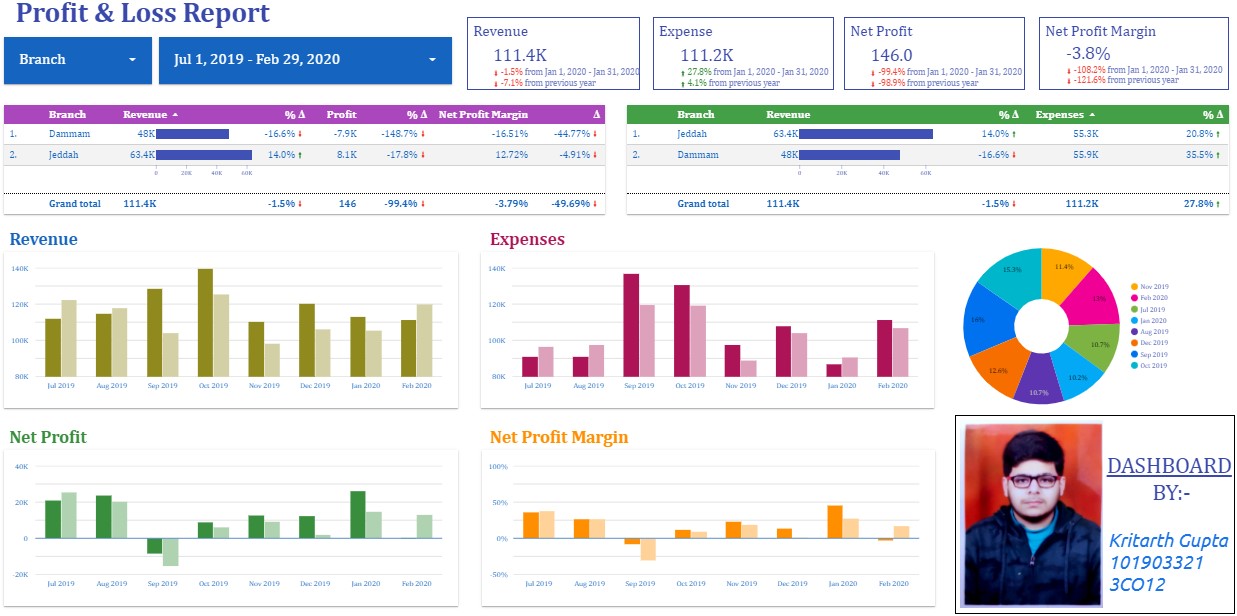
The following is what has been done :-
- Connecting financial data through Google Sheets.
- Inserting Time series charts for Revenue, Expenses, Net profit and net profit Margins.
- Selection of Time series & Report time & Date selection.
- We can also update financial data in the dashboards.
- There are Scorecards to show the comparison of previous data Pie charts, Bar Charts & Area charts.
-First of all we have a report header to make the financial report elegant. -We can easily do the formatting of the header created as per the requirements in dashboard.
-There is a time series chart inserted which can be controlled as per the individual's requirements.
-One can also observe the date formatting if the time series chart shows the value in daily basis. This has been done by editing the data source. The selection of correct format and data in preparation from google data studio will help us to show us accurate results.
-The idea is that we have 2 time fields, the 1st field is in Date format so data studio can understand the Time series and the 2nd date field is in month format to make the time series chart well designed and understandable for google data studio and as well for us.
-We can also convert our line charts to bar chart and move our time series line breaks chart to leave zero corner.